Datastory
We are focusing on seasonal products, being produced in France mainland. Therefore, “exotic” products like bananas or coconut are not taken in account. Therefore, our tools are not representative of total food importation in France.
What are the products France imported the most in 2016 ?
Table of top importations
A closer look for each month
Top products per month
The first information to notice is the preponderance of cereals like soy, colza seed or wheat among the top imported products. Fruits, in particular oranges, tomatoes and melons are also imported a lot.
Looking at the importance of cereals, we decided to evaluate the proportion of cereals among imported products for each month.
Analysis of Cereal products
Cereals accounts for almost half of imported products with a total of 4.15 million tonnes imported in 2016. Looking at the importance of cereals in importation, we figured that a lot of these cereales might not be imported for human consumption, but mostly for livestock: In France, there are more than 19 million cows, 25 million pigs and 48 million fowl that have to be fed in addition to the french population (70 millions inhabitants). Therefore, a very large proportion of imported products are aimed to produce meat in France.
Comparison between Importations and Productions
Most food categories are produced in France: indeed, France is the first agricultural power in Europe, and is 8th in the world. It is also a major exporter of agricultural products. Imported products is therefore only a small proportion (7%) of products available in France.
However, we can observe that the proportion of imported products rises in winter: This is due to the fact that less products are able to grow in France during winter. The small proportion of imported products in December is related to the harvest of most cereals during this month, as indicated by our source for seasonal products: Greenpeace
.
.
Top produced food categories
The main produced food categories in winter are sugar beets, potatoes, apples, carrots, turnips and onions.
In may, tomatoes begin to be massively produced which is consistent with the season of tomatoes in France. Then in summer, cereals are the main products being harvested. In autumn, the production is balanced between cereals and seasonnal fruits.
Where are these products coming from ?
Top exporting countries
Spain is by far the biggest importer to France. The bordering countries as Spain, Belgium, Germany and Italy are among the top 10 importing countries, as the cost for transportation is reduced. Moreover, this results is also explained by European legislation promoting agricultural trade between countries. Some non-European countries like Morocco, the US and Canada are major importing countries to France as well.
Analysis by months
In this plot, the countries being further than 10000km from France are displayed in red, those between 3000-10000km in orange and those between 0-3000km in green. Spain is always the first importer for France, at the exception of October where Bulgaria is.
One may wonder whether the product types imported from Spain are also produced in France.
One may wonder whether the product types imported from Spain are also produced in France.
Spain, a close trading partner
When looking at the top imported products coming from Spain, we can observe that most of the categories are fruits and vegetables. This suggest that the weather in Spain makes it more prone to grow such products throughout the year.
Now let's have a look on a country in the south hemisphere, where the climate and the seasons are different from France.
Now let's have a look on a country in the south hemisphere, where the climate and the seasons are different from France.
Brazil as top exporter of south hemisphere
The main product imported from Brazil is soy (more than 200 million kg!) which is mostly used for animal feeding. This is a concerning issue as soy farming is a major cause of the deforestation of the savana.
The second most imported product is lemon/lime. If one select 'lime' in our second tool, one would see that this product is indeed mostly imported from distant countries.
The second most imported product is lemon/lime. If one select 'lime' in our second tool, one would see that this product is indeed mostly imported from distant countries.
Further analysis of distance parameter
Density distance graph
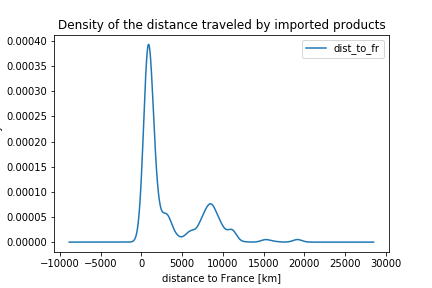
The plot above represents the number of entry recorded in the importation file (independently of the mass imported) in function of their distance. We can observe a first peak recorded at low distances, that show the importance of neighboring countries for importation. A second peak for approximately 8000 km is observed. This corresponds to the distance separating France from continents on the other side of the Pacific ocean like Canada, or Brazil.
Mass distribution in function of distance
The plot above represents the total mass imported in function of the distance traveled to France for all the products. Once again, we can see that a high proportion of total mass is imported from countries that are relatively close, with a major peak at 800 km, corresponding to Spain. Some other peaks at 6000 and 8000 km are once again related to countries across the Pacific Ocean. The peak at 15 000 km corresponds to Australia, and the peak at 18 000 km corresponds to New Zealand.
Analysis of distance per month
The boxplots of the distance for each month represented above are evaluated to be significantly different from the mean value of the population (3911 km) when colored in yellow. We can observe that products in January and February comes from relatively closer places than average for the year. In contrary, products in May comes from further places than in average.
This seems a little bit counter intuitive, as one would think that the weather in France neighboring countries is similar, and therefore it’s more difficult to grow crops in winter than in summer in these countries too. However, we hypothesized that the demand for fruits like strawberries, melon or watermelon might be higher in May, just before their season in France, because it’s well known that eating those fruits in winter is not great for the environment, but in May, it does not sound as bad. However, neighboring countries are not able either to produce kiwis, strawberries, melons in May, so we have to import them from further countries.
This seems a little bit counter intuitive, as one would think that the weather in France neighboring countries is similar, and therefore it’s more difficult to grow crops in winter than in summer in these countries too. However, we hypothesized that the demand for fruits like strawberries, melon or watermelon might be higher in May, just before their season in France, because it’s well known that eating those fruits in winter is not great for the environment, but in May, it does not sound as bad. However, neighboring countries are not able either to produce kiwis, strawberries, melons in May, so we have to import them from further countries.
Strawberries and Melon, how consommation habits deeply influence importations
When selection "strawberries" or "other melon" in the second visualization tool,
we can clearly see that for both fruits, there’s a peak of importation before their season, perhaps due to hypothesis explained above.
Also, some products like kiwis for example, have their season in winter and are more imported in summer: It is not well known that kiwi’s season is in winter, so people may still buy kiwis in summer thinking they do right, and France has to import more kiwis in summer than in Winter.
Produced imported from distant countries
Even though oranges and potatoes are among the top imported products, they do not come from very distant countries.
However, some products here like tomatoes, watermelon, peach, and clementines are also massively imported. When buying these products, one has to be careful about their origin as their importation generates high carbon emissions.
On the contrary, rice, apricots, carrots and spinach come from distant countries while they are not among the top imported products.
We have to take care before driving conclusions because the calculation of the mean distance is biased by the mass importations.
So, what are the products where importations seems justified ?
Now that we have gathered enough informations regarding french importations of seasonal products. We can classify the products depending on where they come from, how much and when.
Those informations are gathered in the calendar of visualization 2.
By computing the mean index for the whole year, one can see how 'well' a products is imported. It is calculated by normalizing the mean distance of the month with the maximum mean distance of the year, and adding it to the normalized Math. Twice as much weight is given by the distance part of the index calculation. Therefore, it does not take into account the mass of french production, nor the season of production. Tables below shows the products with the highest and lowest indexes.
By computing the mean index for the whole year, one can see how 'well' a products is imported. It is calculated by normalizing the mean distance of the month with the maximum mean distance of the year, and adding it to the normalized Math. Twice as much weight is given by the distance part of the index calculation. Therefore, it does not take into account the mass of french production, nor the season of production. Tables below shows the products with the highest and lowest indexes.
Top and worst products in term of indexes
We can see that sugar beets are one of the ‘best’ imported product: It does not come from far and is not imported highly imported. It is coherent with France production: Beet is one of the most produced food on the french territory, and importation is not needed in this case. In addition, sugar beets can be produced all year in France. This also applies for rye.
On the countrary, some products have been calculated as being "badly" imported. This applies for eggplants, limes and grapefruit for example.
For these products, the median distance of importation is usually higher than for other products. Moreover, those product are not much produced in France (while being considered seasonnal). This is why they appear at the bottom of the ranking.